Ensemble Ensemble
Menu
Home
  • SOLUTIONS
  • Method
    • A Systemic Approach
    • Theory of Constraints
    • Working with us
  • RESOURCES
    • Productivity Scorecard
    • Articles
    • Subscribe
    • Our book
  • Results
  • ABOUT
    • The Just Work Manifesto
    • Our Story
    • Location
Book a call
loader

Language | Operations | Organisation | People | Strategy

View all articles SUBSCRIBE TO NEWSLETTER to get articles and more

STAY CONNECTED AND SIGNUP TO RECEIVE INSIGHT updates

Subscribe

Managing accounting’s relevance

David Hodes, Founder

Eli Goldratt famously said, ‘Tell me how you measure me, and I will tell you how I will behave. If you measure me in an illogical way… do not complain about illogical behaviour.’ If you measure and reward activity, then activity’s what you’ll get.

This is part 2 in a series. Read the other part here: Six Questions for Financial Performance

[ Listen to the audio version, read by David Hodes]

How tempting it is to make everyone busy with production. In our traditional accounting systems, we book all this activity to profits. Credit operating expense as you debit inventory (whether work in process or finished goods), and voilà, by the magic of generally accepted accounting principles, those operating expenses are now counted as an asset on the balance sheet. In other words, you’ve made a profit without adding a dollar of revenue. The chickens come home to roost when you have warehouses full of inventory that no one wants to buy, and you’re compelled to mark them down to raise some cash and clear the way for a product people want to buy.

And don’t think this idea of activity-based costing applies only to manufacturing. Projects, with their system of earned value and the ever-so-popular S-curves, do the same job of ‘absorbing’ activity onto the balance sheet, as operating expense is credited from the project’s profit and loss. But rarely is a link made between the costs thus absorbed and their tenuous link to the critical path of the project, which alone determines when the business benefits start flowing.

What’s an alternative way to assess our business decisions that doesn’t depend on a reductionist framework which mistakenly assumes that the sum of the parts is the determinant of the value created by the whole? After all, that reductionist assumption informs the accounting methods that use activity-based costing as their guiding light.

Let’s recall the words of Charles Horngren, Professor of Accounting at Stanford University, who declared: ‘Relevant information is the predicted future costs and revenues that will differ among alternative actions. The existence of a limiting factor changes the basic assumptions underlying the cost and revenue opportunity of a particular action.’ In simpler terms, he wrote: ‘A company will profit maximise when it sells the product or service with the highest contribution per unit of the scarce resource.’

“In all that complexity was the inherent simplicity of Newton’s laws of motion”

Underpinning Goldratt’s many achievements and insights is the idea that, even in the most complex of environments, there is always an inherent simplicity. I recall him regaling an audience on his only visit to my Sydney hometown with the story of how we view the cosmos. He pointed heavenward and talked of the infinite complexity of the expanding universe: the galaxies, the stars, the planets, the moons, and the swirl of gases. And in all that complexity was the inherent simplicity of Newton’s laws of motion. Using them, we could predict to a reasonable degree where which celestial body was now and where it would be in the future. We didn’t need Einstein or Bohr to approach a more fundamental truth, as what Newton provided us was sufficiently valuable to send man to the moon and back. Physicist that he was, he took this basic idea of inherent simplicity and applied it to the world of work management.

The idea of inherent simplicity is captured in the diagrams below. If we break our system into some assemblage of parts, then the sum of the parts is not equivalent to the whole. Each part on the right-hand side of the diagram, measured by its ability to optimise its production, would inevitably lead to the generation of silos, mis-synchronisation, and departmental conflicts.

On the other hand, if we look at the system view on the left, we can see that if we want to create a leveraged systemic effect, we need only pay attention to the orange sphere, as it is either directly or indirectly connected to every other sphere in the system. A slight improvement there could be a significant gain when measured against overall system performance.

Both Horngren and Goldratt are talking about the fundamental difference between making an improvement at the constraint or doing it anywhere else. How does this idea help us to answer the Six Questions for Financial Performance?

1. Is the overall business profitable?

We know that we can measure profitability using the idea of return on investment, or ROI. In the world of constraint accounting, we measure ROI according to the formula.

Where:

T = Throughput defined as sales less variable costs
OE = Operating Expense usually made up of labour and overheads
I = Investment

The great benefit of using this means of determining profitability is that it can be used from the board room’s global decisions to the work supervisors’ local decisions. And it can be applied to horizons from short to medium to long.

In most cases I’ve encountered, sometimes with more effort than others, this formula can even be applied to decision-making on the shop floor. Should I work on this breakdown or that? Well, which one is likely to have the most significant impact on T, OE, and I? Indeed, any decision we make should have the calculation of ΔT, ΔOE and ΔI, where Δ is the change in the value of the variable that arises as a result of any given decision.

It also makes sense to track the trends of T, OE and I over the last five years and see if T is growing faster than OE over the longer haul. Useful ratios are T:OE, which measures how much throughput is generated for every dollar of operating expense incurred. Anything less than 1, and you’re losing money. T:I is a useful idea for capital productivity—that is, how much throughput is generated for every dollar invested. Both of these ratios should also be plotted over the previous five years to see if you are getting better at generating cash, and forecast for the next five to understand the impact of any investments you might make.

2. Is a given strategic business unit within the overall business profitable?

When we look at the profitability of a given business unit, we must be sure to understand which costs and revenues are strictly associated with that business unit and which are part of the funny money that arises from transfer pricing and cost allocation decisions. In other words, we need to know what happens to T, OE and I at the parent company level if we are to assess the subsidiary business unit properly. We must know the business unit constraint and whether it’s in supply, make or the market. We must understand what cash flows (investments, revenues, margins and costs) the business can generate in the short, medium and long term.

And then, even if the answer to all of these questions comes up in the positive, we must not forget to question the opportunity cost of focusing the ultimate constraint of management attention on this business unit versus the other opportunities available to the parent business.

3. Is a given product or service attractive for us to make and sell?

Once we understand where our constraint is, we can use Horngren’s formula for profit maximisation to establish which of our products or services delivers the most bang-per-buck per unit of the constraint. We call this bang-per-buck ‘product octane’. The chart below shows a plot of a range of products, all of which require the use of the constrained engineering resource. The x-axis shows how much throughput that product will deliver over a year; the y-axis measures the octane—that is, how much scarce resource the product consumes. The blue lines represent the average octane and throughput per annum for all products.

Quadrant one products should be high on the agenda for sales promotion, as they yield a high throughput for every engineering day. There is also the chance to establish elasticity of demand—that is, what happens if you have a slight drop in price that doesn’t affect octane too much?

Quadrant two products are the star performers, and you should always look to be selling more of these. If you can’t further penetrate existing markets, then go out and look for new segments or territories.

Quadrant three represents those products that deliver low sales while overusing the scarce resource (engineering in this case). They should be dropped from the range of products or perhaps outsourced so that they don’t use precious constrained engineering time.

Quadrant four represents solid performers in annual throughput contribution. However, it would be even better if they could be moved into quadrant two by relooking at their design such that they spend less time in engineering.

A similar idea to product or service octane applies to project octane when selecting the portfolio of projects you undertake in any given horizon.

4. Is a given customer or customer segment attractive for us to do business with?

If your constraint is in the marketplace, that is, you cannot get enough customers to buy the capacity you have for generating products and services, you at least need to know if servicing a given customer is profitable. That is, the throughput generated by their sales exceeds the operating costs that would go away if you stopped servicing them.

If your constraint is in make or supply, you could view your customer portfolio through the lens of the octane grid and assess where each customer lands in terms of octane and throughput against the same metric for the next best customer. Rather than saying no to the marginal customer, using them to test your assumptions about pricing is often worthwhile. A price increase could improve octane and make them more attractive than the next best option.

5. Should we make the product or service ourselves or buy it from a third party?

Using the ΔT, ΔOE and ΔI framework gives you a robust way of testing whether a product should be outsourced. As mentioned above, a low octane, low throughput product could be a good candidate for outsourcing if it makes way for more productive use of the capacity it yields. However, if the constraint is in the market, you need to test what the actual impact will be on T, OE and I through the decision to outsource. Proper analysis may indicate it’s better to invest in additional capacity than to outsource production because of the impact on lead times, delivery reliability and the negligible impact it may have on the remaining operating expense.

6.Should we make a given investment?

Investments are usually made as part of the Uplift step of the 5-Step FOCUS. It’s relatively simple to assess if an investment is required due to an existing or anticipated constraint. Notwithstanding the inherent risk associated with any investments, assuming you have done your homework on your assumptions, you can apply the TOEI framework to your decision-making. For any given investment, so long as the uplift in risk-adjusted throughput is sufficiently positive relative to any increase in operating expense, there will be a nett benefit in terms of ROI. Which, after all, is what we’re in business to do.

Read Part One: Six Questions for Financial Performance

____________________________

What’s next?

The change to using Theory of Constraints (TOC) as an underlying operating system is both profound and exhilarating. We’ve developed the Systems Thinker Course to bring the ideas into your organisation.

  • View the Systems Thinker Course Guide (no email required to download)
  • Join us for the Systems Thinker Foundations Workshop (we run this FREE workshop once each month)
  • To find out more about these, or any of our services, simply schedule a call

    ____________________________

    KPI graph on Shutterstock[Background image: KPI graph on Shutterstock]


    __________________________

  • Culture
  • Operations
  • Process
  • Technology

Qairos: Architecting an Ontology of Flow

Ensemble Administrator

David Hodes, Founder

What if the central problem in project execution is not poor reporting, weak discipline, or inconsistent delivery, but the fact that the underlying system was never designed to understand flow in the first place? Qairos starts from a different premise: that work should be modelled not merely as tasks, but as a living system of constraints, dependencies, queues, and throughput.

The first question is no longer “Are we on track?” It is “Where is the constraint?”

Your dashboard is green. The cost performance index sits comfortably above 1. Resource utilisation looks strong. Tasks are being completed. Progress reviews suggest order, control, and predictability. Yet the project is drifting. Engineering approvals are backing up. Crews are busy but not moving the project. Materials arrive only to wait. Management sees comfort in the numbers while the system itself is quietly losing throughput.The issue is not that the organisation cannot see enough.

The issue is that it is seeing the wrong things. This is not fundamentally an execution problem. It is an architectural problem.Traditional project systems are built around a deceptively simple assumption: that the task is the atomic unit of work. Everything rolls up from tasks. Tasks have budgets, durations, owners, and resources. But projects are not simply collections of independent tasks. They are interdependent systems of flow. The governing reality is not activity. It is dependency, capacity, delay, release, queue, and constraint. And in most conventional systems, those things do not exist natively in the model at all.

The system is not failing. It is doing what it was built to do.

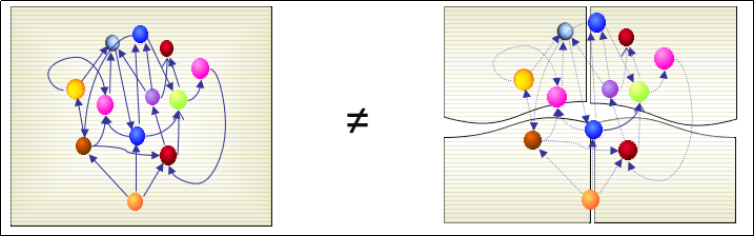
Most industrial work management environments still carry the DNA of accounting systems. They are good at capturing costs, assigning budgets, tracking expenditures, and reporting variances. Scheduling was layered onto that worldview. Execution tools were added. Dashboards became more attractive. But the core paradigm did not change. The system still assumes that if enough local activities are monitored, the project’s global performance will somehow reveal itself. That assumption is wrong.

Flow is not missing from your reports. It is missing from your data model.

In any complex environment, throughput is governed by a constraint. The system moves only as fast as the slowest and most capacity-limited point in the chain of dependencies. Work can accumulate there. Downstream teams can idle or compensate with make-work. Upstream teams can generate inventory that has nowhere useful to go. None of this is unusual. It is the normal physics of work in an interdependent system. What is unusual is how thoroughly conventional project systems fail to represent it.

There is usually no native object for a constraint. No primary metric for queue depth. No mechanism for expressing how one process consumes work from another at a given rate. There are predecessor-successor links, but not a true ontology of flow. The result is that management receives precise visibility into local activity while remaining structurally blind to the behaviour that actually governs delivery.

Why green dashboards so often coincide with poor outcomes

Consider a major project where structural engineering approvals are the real bottleneck. Construction teams cannot progress critical work until designs are released. Procurement can deliver materials exactly as planned, but if approved drawings are late, those materials simply wait. Construction supervisors, pressured to keep crews productive, generate preparatory work, rework, or non-critical tasks. Resource utilisation stays high. Procurement performance looks strong. Cost variance remains acceptable. On the dashboard, nearly everything looks healthy.

But the project is not flowing. It is spending money efficiently on the wrong work. The constraint is starving downstream throughput while non-constraint functions optimise themselves around a false picture of success. This is the great deception of local metrics. They tell each part of the system that it is succeeding while the whole is deteriorating.

The system spent money efficiently on the wrong work

The problem is not that the reports are inaccurate. The problem is that they are measuring symptoms instead of causes. They can tell you that Task A is late or Resource Pool B is overloaded. They cannot tell you that the governing reason is a queue building upstream at the one point in the system that truly determines throughput.

The hidden damage done by the pursuit of utilisation

One of the clearest examples of this distortion is the treatment of utilisation. In traditional management logic, high utilisation is almost always read as a positive sign. It suggests productive labour, efficient supervision, and strong operational discipline. But in a system governed by constraints, non-constraint resources must have excess capacity by definition. Their role is not to remain fully occupied at all times. Their role is to support the constraint and protect the system’s throughput.

When management systems reward high utilisation indiscriminately, supervisors are pushed to keep people busy, whether or not the work contributes to flow. That pressure creates premature work, excess work-in-progress, rework, administrative noise, and inventory that has to be managed later. Labour is consumed, but throughput does not improve. In many cases, it worsens because the organisation expends effort on competing activities instead of subordinating itself to the system’s real needs.

High utilisation in the wrong place is not efficiency. It is expensive distraction.

The accounting view struggles to distinguish between labour spent advancing throughput and labour spent creating expensive distractions. Both consume hours. Both can look productive in reports. But one protects the system and the other burdens it.

Why intelligent people cannot fix a structurally blind system

Experienced leaders often sense that something is wrong. They recognise that the project appears busy but is not decisively productive. They notice that certain approvals, interfaces, or decisions seem to govern the pace of everything else. But when they try to raise the issue, they are asked to show the data. And the system cannot provide it in a usable form.

There is no live queue-depth signal. No model of production and consumption rates between processes. No architecture that elevates the constraint into view. So even correct intuition struggles to become operational action. The issue is not a lack of intelligence. It is the absence of representational infrastructure.

You cannot manage what your system cannot represent.

At the same time, incentives reinforce the blindness. Construction managers are measured on crew utilisation and cost. Procurement teams are measured on delivery performance. Engineers are measured on their own commitments. Few, if any, are measured on system throughput. Everyone behaves rationally according to the metrics that govern them. The irrationality emerges at the level of the whole.

When projects fail, execution is blamed for architectural flaws

Once the pain is undeniable, organisations almost always diagnose the problem as one of execution. They tighten controls, add oversight, increase reporting cadence, restructure teams, or replace leaders. Yet these interventions operate inside the same broken frame. They assume the model was sound and the people fell short. More often, the opposite is true: the people did exactly what the system told them to do.

It’s impossible to execute your way out of a planning and control architecture that cannot see the thing governing throughput.

If the system cannot identify the constraint, it cannot prioritise correctly. If it cannot prioritise correctly, it cannot subordinate non-critical work. If it cannot subordinate, then local success will continue to masquerade as global progress. What appears to be poor execution is frequently faithful execution of a structurally incorrect plan.

From measurement to intelligence

The real shift is not from one dashboard to a better dashboard. It is from measurement to intelligence. Measurement tells you what happened. Intelligence reveals what is happening, why it is happening, and what is likely to happen next.

In a flow architecture, dependencies are not merely sequences of tasks. They are explicit relationships between producing and consuming processes. Capacity is represented. Demand is represented. Queue tolerance is visible. The system can identify where work is accumulating, where release rates exceed processing rates, and where throughput is most exposed.

The system must be re-architected around flow as a native concept.

Constraint identification becomes the first organising principle rather than a secondary analytical exercise. The primary question changes. Instead of asking whether tasks are on schedule, the organisation asks where the constraint is and whether the system is protecting it. Reporting changes accordingly. Queue depth at dependency points matters. Buffer consumption matters. Constraint load matters. Release logic matters. Task completion percentages become secondary rather than definitive.

Once this ontology is in place, genuinely intelligent control becomes possible. If a delay occurs, the system can rapidly identify the new governing point, recalculate the likely impact, and indicate which activities should pause, continue, or be redirected. Non-constraint resources can be prevented from working too far ahead and generating waste. Local optimisation becomes harder to sustain because the system itself embodies a different logic.

Why this feels threatening to many organisations

Better measurement is easy to welcome because it usually leaves authority structures intact. It provides richer reports, cleaner dashboards, and more polished governance rituals. Intelligence is different. It challenges the way decisions are made. It reveals misalignment in real time.

Intelligence forces uncomfortable questions about whether teams are pursuing the right objectives at all.

That is why true intelligence architecture is not simply a software procurement exercise. It is a capability shift. It demands a different understanding of work, different leadership habits, and different forms of accountability. It requires organisations to replace the comfort of descriptive metrics with the discipline of causal visibility.

The irreversible moment

There is a point at which the old worldview becomes impossible to recover. It comes when a delay is logged and, instead of waiting days for a variance report, the system immediately shows the shift in the governing constraint, highlights the downstream implications, and recommends how to avoid generating fresh waste.

What once required retrospective interpretation becomes immediate, operational sense-making.

Once leaders have experienced that, traditional reporting starts to feel theatrical. It becomes obvious that static green metrics can coexist with a system that is slowly choking itself. At that point the shift is no longer conceptual. It becomes visceral. The organisation can see the difference between being informed about the past and being guided in the present.

Where transformation begins

The transformation does not begin with replacing every tool. It begins with changing the ontology. Dependency mapping must become explicit and non-negotiable. The organisation must define not merely which tasks follow which tasks, but which processes produce for which other processes, at what rate, with what capacity, and with what tolerance for waiting. Once that happens, the constraint can become visible by design.

This is where Qairos enters the picture. Qairos is not simply another layer of reporting over traditional project controls. It represents a different way of modelling work, one in which flow is native, constraints are explicit, and intelligence emerges from the architecture itself. It recognises that the system should not merely record activity. It should help the enterprise understand the living dynamics that determine safe, timely, cost-effective delivery.

Rethinking work management starts with rethinking what the system can see.

That matters now more than ever. Modern projects operate amid volatility, long supply chains, digital interdependence, regulatory pressure, and little tolerance for overruns. Constraints shift faster than periodic reporting can detect. By the time old systems explain where the problem was, the system has often moved on. In that environment, conventional measurement is not just outdated. It is structurally incompatible with the speed and complexity of the work.

Every project platform embodies a worldview. One worldview says that control comes from measuring tasks and maximising utilisation. The other says that control comes from understanding flow and governing the constraint. Qairos stands with the latter. It is an argument for a more intelligent ontology of work, one that makes the hidden physics of delivery visible, actionable, and ultimately governable.

Qairos is built for organisations that want more than retrospective reporting. It is for leaders who want to understand the true dynamics of flow, protect throughput, and make better decisions while the work is still unfolding.

Book a call
View all articles

READ MORE

  • Language
  • Operations
  • Organisation
  • Process
  • Strategy

Measurably reliable and agile

David Hodes, Founder

Few performance standards deliver the competitive advantage you gain by keeping your promise to deliver on time, doing so faster than your competitors, and suffering no defects while you’re about it.(more…)

READ MORE

More than just work

Discover better ways to do better work.

Fresh insights, every Friday

We alternate our own actionable articles with three relevant links from other authorities.

We’ll only use your email address for this newsletter. No sales calls

Subscribe to 'Perspectives'

More Than Just Work
Weekly productivity insights

Subscribe
  • EnsembleConsultingGroup
  • Share Page
  • +61 2 9387 3955
  • info@EnsembleConsultingGroup.com

Site proudly designed by Brand Fibre

More than just work

Discover better ways to do better work.

Fresh insights, every Friday

We alternate our own actionable articles with three relevant links from other authorities.


We’ll only use your email address for this newsletter. No sales calls

What is to get in touch with you?


white_arrow white_bidirection_arrow arrow-right-green arrow-right-orange arrow-right arrow-left blue_arrow blue_round_arrow tick

Want us to get in touch with you?

 
Thank you for your interest. We will call you back.