


Language | Operations | Organisation | People | Strategy
STAY CONNECTED AND SIGNUP TO RECEIVE INSIGHT updates
Eli Goldratt famously said, ‘Tell me how you measure me, and I will tell you how I will behave. If you measure me in an illogical way… do not complain about illogical behaviour.’ If you measure and reward activity, then activity’s what you’ll get.
This is part 2 in a series. Read the other part here: Six Questions for Financial Performance
[ Listen to the audio version, read by David Hodes]
How tempting it is to make everyone busy with production. In our traditional accounting systems, we book all this activity to profits. Credit operating expense as you debit inventory (whether work in process or finished goods), and voilà, by the magic of generally accepted accounting principles, those operating expenses are now counted as an asset on the balance sheet. In other words, you’ve made a profit without adding a dollar of revenue. The chickens come home to roost when you have warehouses full of inventory that no one wants to buy, and you’re compelled to mark them down to raise some cash and clear the way for a product people want to buy.
And don’t think this idea of activity-based costing applies only to manufacturing. Projects, with their system of earned value and the ever-so-popular S-curves, do the same job of ‘absorbing’ activity onto the balance sheet, as operating expense is credited from the project’s profit and loss. But rarely is a link made between the costs thus absorbed and their tenuous link to the critical path of the project, which alone determines when the business benefits start flowing.
What’s an alternative way to assess our business decisions that doesn’t depend on a reductionist framework which mistakenly assumes that the sum of the parts is the determinant of the value created by the whole? After all, that reductionist assumption informs the accounting methods that use activity-based costing as their guiding light.
Let’s recall the words of Charles Horngren, Professor of Accounting at Stanford University, who declared: ‘Relevant information is the predicted future costs and revenues that will differ among alternative actions. The existence of a limiting factor changes the basic assumptions underlying the cost and revenue opportunity of a particular action.’ In simpler terms, he wrote: ‘A company will profit maximise when it sells the product or service with the highest contribution per unit of the scarce resource.’
“In all that complexity was the inherent simplicity of Newton’s laws of motion”
Underpinning Goldratt’s many achievements and insights is the idea that, even in the most complex of environments, there is always an inherent simplicity. I recall him regaling an audience on his only visit to my Sydney hometown with the story of how we view the cosmos. He pointed heavenward and talked of the infinite complexity of the expanding universe: the galaxies, the stars, the planets, the moons, and the swirl of gases. And in all that complexity was the inherent simplicity of Newton’s laws of motion. Using them, we could predict to a reasonable degree where which celestial body was now and where it would be in the future. We didn’t need Einstein or Bohr to approach a more fundamental truth, as what Newton provided us was sufficiently valuable to send man to the moon and back. Physicist that he was, he took this basic idea of inherent simplicity and applied it to the world of work management.
The idea of inherent simplicity is captured in the diagrams below. If we break our system into some assemblage of parts, then the sum of the parts is not equivalent to the whole. Each part on the right-hand side of the diagram, measured by its ability to optimise its production, would inevitably lead to the generation of silos, mis-synchronisation, and departmental conflicts.
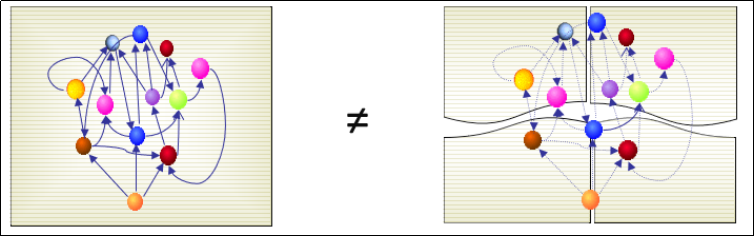
On the other hand, if we look at the system view on the left, we can see that if we want to create a leveraged systemic effect, we need only pay attention to the orange sphere, as it is either directly or indirectly connected to every other sphere in the system. A slight improvement there could be a significant gain when measured against overall system performance.
Both Horngren and Goldratt are talking about the fundamental difference between making an improvement at the constraint or doing it anywhere else. How does this idea help us to answer the Six Questions for Financial Performance?
1. Is the overall business profitable?
We know that we can measure profitability using the idea of return on investment, or ROI. In the world of constraint accounting, we measure ROI according to the formula.
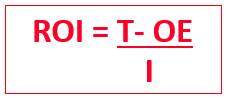
Where:
T = Throughput defined as sales less variable costs
OE = Operating Expense usually made up of labour and overheads
I = Investment
The great benefit of using this means of determining profitability is that it can be used from the board room’s global decisions to the work supervisors’ local decisions. And it can be applied to horizons from short to medium to long.
In most cases I’ve encountered, sometimes with more effort than others, this formula can even be applied to decision-making on the shop floor. Should I work on this breakdown or that? Well, which one is likely to have the most significant impact on T, OE, and I? Indeed, any decision we make should have the calculation of ΔT, ΔOE and ΔI, where Δ is the change in the value of the variable that arises as a result of any given decision.
It also makes sense to track the trends of T, OE and I over the last five years and see if T is growing faster than OE over the longer haul. Useful ratios are T:OE, which measures how much throughput is generated for every dollar of operating expense incurred. Anything less than 1, and you’re losing money. T:I is a useful idea for capital productivity—that is, how much throughput is generated for every dollar invested. Both of these ratios should also be plotted over the previous five years to see if you are getting better at generating cash, and forecast for the next five to understand the impact of any investments you might make.
2. Is a given strategic business unit within the overall business profitable?
When we look at the profitability of a given business unit, we must be sure to understand which costs and revenues are strictly associated with that business unit and which are part of the funny money that arises from transfer pricing and cost allocation decisions. In other words, we need to know what happens to T, OE and I at the parent company level if we are to assess the subsidiary business unit properly. We must know the business unit constraint and whether it’s in supply, make or the market. We must understand what cash flows (investments, revenues, margins and costs) the business can generate in the short, medium and long term.
And then, even if the answer to all of these questions comes up in the positive, we must not forget to question the opportunity cost of focusing the ultimate constraint of management attention on this business unit versus the other opportunities available to the parent business.
3. Is a given product or service attractive for us to make and sell?
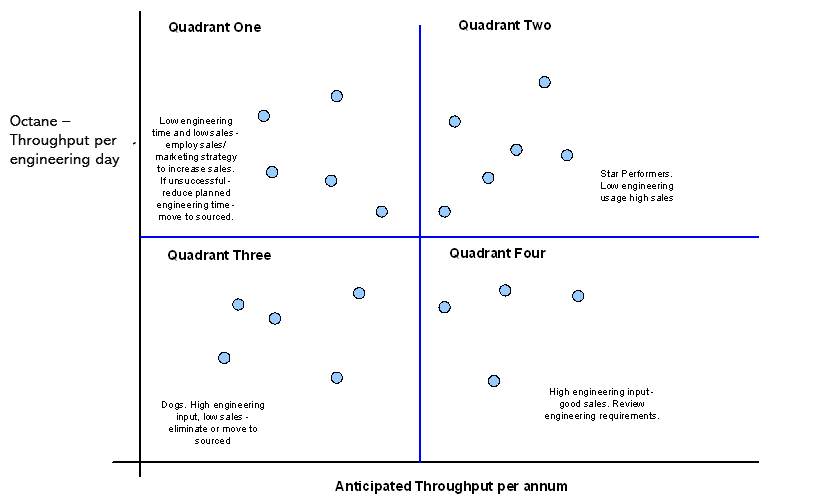
Once we understand where our constraint is, we can use Horngren’s formula for profit maximisation to establish which of our products or services delivers the most bang-per-buck per unit of the constraint. We call this bang-per-buck ‘product octane’. The chart below shows a plot of a range of products, all of which require the use of the constrained engineering resource. The x-axis shows how much throughput that product will deliver over a year; the y-axis measures the octane—that is, how much scarce resource the product consumes. The blue lines represent the average octane and throughput per annum for all products.
Quadrant one products should be high on the agenda for sales promotion, as they yield a high throughput for every engineering day. There is also the chance to establish elasticity of demand—that is, what happens if you have a slight drop in price that doesn’t affect octane too much?
Quadrant two products are the star performers, and you should always look to be selling more of these. If you can’t further penetrate existing markets, then go out and look for new segments or territories.
Quadrant three represents those products that deliver low sales while overusing the scarce resource (engineering in this case). They should be dropped from the range of products or perhaps outsourced so that they don’t use precious constrained engineering time.
Quadrant four represents solid performers in annual throughput contribution. However, it would be even better if they could be moved into quadrant two by relooking at their design such that they spend less time in engineering.
A similar idea to product or service octane applies to project octane when selecting the portfolio of projects you undertake in any given horizon.
4. Is a given customer or customer segment attractive for us to do business with?
If your constraint is in the marketplace, that is, you cannot get enough customers to buy the capacity you have for generating products and services, you at least need to know if servicing a given customer is profitable. That is, the throughput generated by their sales exceeds the operating costs that would go away if you stopped servicing them.
If your constraint is in make or supply, you could view your customer portfolio through the lens of the octane grid and assess where each customer lands in terms of octane and throughput against the same metric for the next best customer. Rather than saying no to the marginal customer, using them to test your assumptions about pricing is often worthwhile. A price increase could improve octane and make them more attractive than the next best option.
5. Should we make the product or service ourselves or buy it from a third party?
Using the ΔT, ΔOE and ΔI framework gives you a robust way of testing whether a product should be outsourced. As mentioned above, a low octane, low throughput product could be a good candidate for outsourcing if it makes way for more productive use of the capacity it yields. However, if the constraint is in the market, you need to test what the actual impact will be on T, OE and I through the decision to outsource. Proper analysis may indicate it’s better to invest in additional capacity than to outsource production because of the impact on lead times, delivery reliability and the negligible impact it may have on the remaining operating expense.
6.Should we make a given investment?
Investments are usually made as part of the Uplift step of the 5-Step FOCUS. It’s relatively simple to assess if an investment is required due to an existing or anticipated constraint. Notwithstanding the inherent risk associated with any investments, assuming you have done your homework on your assumptions, you can apply the TOEI framework to your decision-making. For any given investment, so long as the uplift in risk-adjusted throughput is sufficiently positive relative to any increase in operating expense, there will be a nett benefit in terms of ROI. Which, after all, is what we’re in business to do.
Read Part One: Six Questions for Financial Performance
____________________________
What’s next?
The change to using Theory of Constraints (TOC) as an underlying operating system is both profound and exhilarating. We’ve developed the Systems Thinker Course to bring the ideas into your organisation.
- View the Systems Thinker Course Guide (no email required to download)
- Join us for the Systems Thinker Foundations Workshop (we run this FREE workshop once each month)
- To find out more about these, or any of our services, simply schedule a call
____________________________
 [Background image: KPI graph on Shutterstock]
__________________________
An AI Enabled Mining and Metals Operating Model
The Shortest Path From Mineral Potential to the Highest Sustainable Cash Flow
A mining investment earns its return through the conversion of mineral potential into dependable cash flow. Every uncertainty, delay and misplaced commitment along that journey affects how much capital is required, how long it remains exposed and what the investment ultimately delivers.
For those who allocate capital, the challenge extends beyond identifying an attractive resource. The acquisition thesis depends on connected decisions across geology, studies, approvals, construction, commissioning, production and closure. Each decision can strengthen the investment case or quietly erode it.
An AI enabled Mining and Metals Operating System connects evidence, reasoning, accountability and execution across that journey. Systems Thinking provides the whole asset perspective. The Theory of Constraints directs attention towards the factor governing value today. AI helps people interpret information, examine alternatives and coordinate the work required to change the outcome.
“Where is the greatest gap between the value this asset could credibly create and the value it is currently on course to deliver?”
The operating model below brings these ideas together: human accountability above, the life of mine across the centre, and integrated knowledge and reasoning supporting every stage.
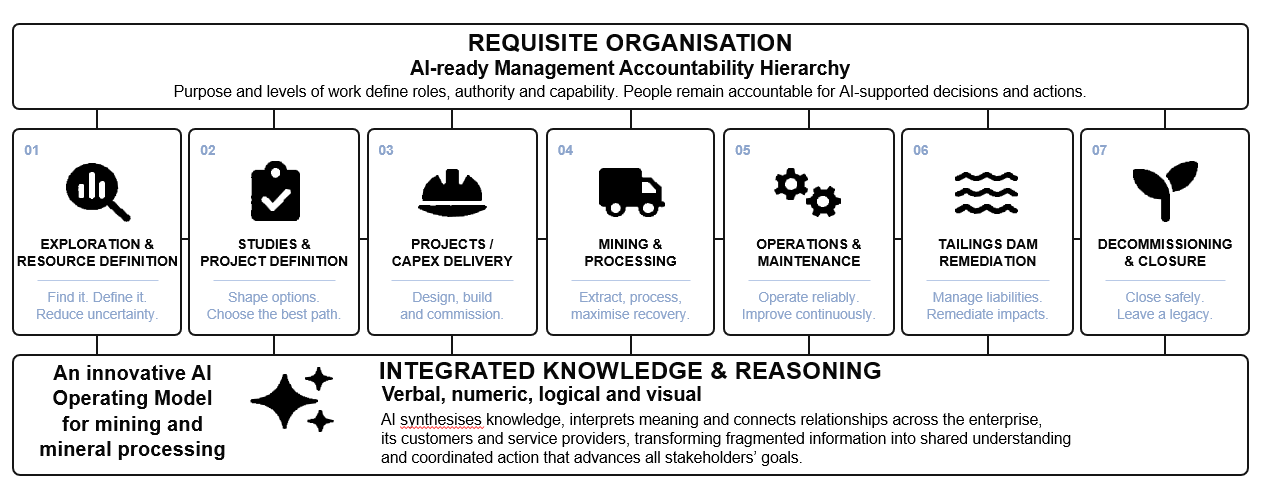
Requisite Organisation: put accountability where the work sits
An operating system needs a clear management accountability hierarchy. Purpose and levels of work define the decisions people must make, the authority they require and the capability needed to carry their responsibilities.
A supervisor protecting today’s production, a project director preparing commissioning and a board allocating development capital face different levels of complexity and different time horizons. Each needs information appropriate to the work, clear decision rights and a reliable route for escalation.
AI makes this clarity more important. Recommendations must have accountable human owners, particularly where commitments cross the boundaries between investors, asset owners, contractors and service providers.
For investors, this provides a practical test of execution capability: can the organisation show who owns each assumption in the investment thesis, who can authorise action and how unresolved issues reach the right decision maker?
Exploration and Resource Definition: reduce the uncertainty that matters
Exploration creates value when it resolves uncertainty that changes a worthwhile decision. More data becomes useful when it improves confidence about what is present, where it lies and what further work is justified.
AI can help connect geological reports, assay results, drilling records, geophysical observations and three dimensional interpretations. Shared terminology and traceable relationships allow teams to compare evidence, expose inconsistencies and distinguish observations from interpretations.
The investor’s question is which uncertainty governs the next commitment. A targeted investigation may change the development route, support further drilling or reveal that the opportunity cannot yet justify additional capital.
New sensing and interpretation methods must earn confidence through appropriate validation. The objective is a better sequence of learning and commitment, with uncertainty visible throughout.
Studies and Project Definition: shape options before locking in capital
Studies turn a resource opportunity into choices about mine planning, processing routes, infrastructure, scale and development sequence. Those choices establish much of the future cost, risk and operating flexibility of the asset.
An integrated operating system connects technical narratives, economic models, engineering constraints and spatial representations. Teams can examine whether assumptions agree across disciplines and whether the preferred option remains attractive under plausible changes in conditions.
Approvals, water, power, logistics and workforce requirements belong in this comparison from the outset. Internal experience and relevant external benchmarks can challenge optimistic estimates.
For investors, the benefit is a clearer explanation of why an option deserves funding, what could defeat it and which evidence should be obtained before the next irreversible commitment.
“The most valuable early action may be the one that changes the next capital decision.”
Projects and Capex Delivery: keep the investment case alive
Once capital is committed, the central question becomes whether the project remains on course to deliver its business case. Progress percentages alone cannot answer it.
Engineering maturity, procurement, construction sequencing, approvals and commissioning readiness must be considered together. Individually manageable deviations can combine into a material threat to first production and cash flow.
AI supported delivery intelligence can connect schedules, costs, risks and physical evidence, helping teams identify contradictions and emerging dependencies between formal review gates.
Management can then assess intervention options while choices remain available. A useful assurance process explains what changed, why it matters, who must act and when. Success appears in improved delivery confidence, controlled capital exposure and a credible route into operation.
Mining and Processing: manage the constraint governing saleable output
The economic performance of a mine depends on how extraction, material movement and processing work together. Improving one activity can consume capital without improving the whole.
If processing capacity governs saleable output, increasing mining volumes may simply build stockpiles and working capital. If feed variability constrains recovery, additional plant availability may deliver less benefit than expected.
Connecting mine plans, ore characteristics, plant conditions and production results helps teams investigate these relationships. AI can support the comparison of operating choices, while physical models and simulation help test their consequences.
The discipline is to find the constraint, optimise for it, collaborate around it, uplift it and start again. The measure is the resulting contribution to cash generation, with safety, quality and environmental obligations respected.
Operations and Maintenance: protect the flow of value
Maintenance creates value through its effect on the productive capability of the system. Equipment critical to the governing constraint deserves particular attention because its failure can interrupt the entire flow of output.
An integrated operating system connects procedures, equipment histories, sensor readings, work orders, spare parts and operating conditions. Consistent asset identities and failure classifications help teams interpret information across systems.
AI can support prioritisation and flag emerging patterns for investigation. Simulation can also help operators and maintainers rehearse commissioning, abnormal conditions and recovery from disruption.
For investors, the question is whether this changes reliability and economics: more dependable throughput, better recovery, fewer damaging interruptions and a sustainable balance between production demands and asset capability.
Tailings Dam Remediation: connect obligations with operating decisions
Tailings facilities connect engineering performance, environmental responsibility, operational continuity and long term liability. Their condition and management belong within the investment case.
Inspection reports, monitoring data, risk thresholds, drawings and terrain models can be brought into a shared context. AI can help identify inconsistent records, surface changes requiring attention and connect actions with accountable owners.
Qualified professionals must interpret the evidence and authorise decisions. Traceability matters: the organisation should be able to show what was observed, how it was assessed and what followed.
Where reprocessing or resource recovery is contemplated, the opportunity requires its own technical and economic evidence. Potential value must be considered alongside remediation obligations, additional capital and the consequences of disturbing existing facilities.
Decommissioning and Closure: design the legacy into the economics
Closure decisions begin long before production ends. Land disturbance, infrastructure choices, water management and waste handling can create obligations that persist beyond an investor’s ownership period.
Connecting closure plans with operating and capital decisions helps reveal those consequences earlier. Progressive rehabilitation can be evaluated alongside production needs, while evolving assumptions remain visible in forecasts and decision records.
AI can support the organisation of obligations, evidence and dependencies across the asset’s life. Credible cost estimates and technical judgments remain essential.
For investors, better closure visibility informs valuation, capital planning and exit readiness. A future buyer needs confidence that liabilities are understood, supported by evidence and reflected in the economics.
Integrated Knowledge and Reasoning: connect evidence with action
Supporting every stage is the ability to reason across verbal, numeric, logical and spatial information. Reports explain intent; models quantify consequences; rules establish conditions; drawings and three dimensional models reveal physical relationships.
These sources need shared meaning, or semantics, and explicit relationships, or ontology, within the organisation and across customers and service providers. Otherwise, apparently connected systems can continue to describe different realities.
For example, “ready for commissioning” should connect to agreed requirements for construction completion, inspection, training and operational acceptance.
AI agents can help trace dependencies, identify conflicting assumptions and prepare options. The operating system then connects decisions to owners, scheduled work and completion evidence. Learning from the result updates the next decision.
“Enterprise value is the product. Capabilities are the machinery.”
What’s next?
Begin with one material value problem. Establish the economic baseline and current trajectory. Identify the governing constraint, material uncertainties and credible intervention options. Agree accountable owners, decision gates and a practical action pathway.
Measure the result through time to cash, throughput, recovery, capital exposure, operating cost and liability. Translate changes into the investment model, including implementation costs and avoiding double counting.
An AI enabled Mining and Metals Operating System earns its place when it helps change the asset’s economic trajectory. For investors, the opportunity is a repeatable capability for converting mineral potential into realised value.
Validating medical device concepts before major investment
Concept validation
A concept can look convincing in a presentation and still make an important task harder. A patient may misunderstand an indicator. A clinician may need information the design does not provide. A promising workflow may depend on support unavailable in the intended setting.
These problems become more expensive when the organization discovers them after committing to architecture, tooling or a launch plan.
We must ask how effectively concepts are validated before significant resources are committed. Patient Centered Design treats this as a learning discipline: turn ideas into testable solutions rapidly using low fidelity prototyping, put them in front of relevant users and gather evidence about whether they improve the outcomes that matter.
“A convincing presentation shows what the team hopes will happen. A useful test reveals what people actually do.”
Begin with a question that can change the decision
A prototype without a learning objective can generate interesting comments while leaving the key decision unresolved. Start by identifying what must be true for the concept to succeed.
Does the patient intuitively understand the required action without explanation? Can the professional recognize when the result is ready to use? Does the proposed approach fit the work surrounding the task? Will people take meaningful steps toward adoption?
State the assumption and the evidence needed to assess it. Agree what would support proceeding, what would require revision and what could make the concept unviable. Gather quantitative data along with qualitative verbal feedback.
Prioritize questions with substantial consequences for the investment. An attractive enclosure deserves less attention than an unresolved issue that could prevent safe or practical use of the whole solution.
Choose the simplest useful representation
A picture is worth a thousand words. A simple user experience prototype is worth a thousand pictures. Choose artifacts that maximize learning with the least effort. The appropriate artifact depends on what the team needs to discover.
A sketch may help users explain how they interpret a proposed interaction. A physical mock-up may expose handling difficulties. A simulated interface can support a sequence of tasks. A more complete prototype may be necessary to examine timing, feedback or combined interactions.
Build enough realism to test the assumption accurately. Excessive detail can consume resources without improving the evidence, while insufficient fidelity can conceal the issue being investigated.
Make limitations clear to participants and observers. A manually simulated function may help test an experience, but it does not establish that the technology can deliver that function reliably.
Recruit people who represent the intended use
Patients and healthcare professionals can differ in experience, confidence, physical ability, responsibilities, and access to support. Those differences influence whether the concept helps them complete the job.
Define the participants and contexts relevant to the test. Include people whose circumstances could expose difficulties the development team has overlooked.
A familiar expert may work around a confusing interface that challenges a new user. A clinician from a highly supported center may assume resources unavailable elsewhere. Research needs to reveal these dependencies.
Match the study to its purpose. Exploratory sessions can identify problems and guide iteration. They do not automatically establish population-wide performance or replace the evidence required for later design validation.
Create an Experience Café around real tasks
An Experience Café gives participants a structured opportunity to encounter concepts and talk about their experience. Its value comes from the quality of the scenario, observation and follow-up questions.
Set up situations that reflect what the person is trying to accomplish. Let participants interact with the artifact rather than rely solely on a demonstration by its designer. Build rough and rapid.
Assign roles to facilitators and observers. Agree how comments, actions and difficulties will be captured. Keep the session focused on learning rather than defending the proposed solution. Hold a conversation around the prototype. “Can you show me how you would use this?” “Tell me what you are thinking here.”
Ask participants to explain what they believe is happening and what they would do next. Observe where the concept supports that understanding and where they hesitate, improvise or seek help.
Listen without teaching away the problem
A facilitator can unintentionally make a weak concept appear successful by explaining each step or supplying missing information.
Use neutral prompts and allow participants to reveal their interpretation. When assistance is necessary, record it along with the point at which the person became stuck.
Follow observations with questions about purpose and reasoning. What did the participant expect? Which information did they look for? Why did they choose that action?
Separate a preference from evidence about task performance. “I like this one” may reflect appearance or familiarity. Successful completion, appropriate interpretation and manageable effort provide a stronger basis for assessing whether the concept addresses the need.
“Every explanation the facilitator must supply is a question about what the design expects the user to know.”
Examine the complete experience
The product interaction belongs within a wider job. Test preparation, readiness, execution, monitoring and what follows, wherever these activities affect the concept’s value.
A device may work well once configured while setup introduces avoidable complexity. A result may be easy to view while the professional still needs to transfer it manually before acting.
Include relevant dependencies on caregivers, staff, information and other systems. Investigate whether the concept reduces burden for one participant by increasing it for another.
Use realistic scenarios appropriate to the development stage. Important exceptions and recovery steps deserve attention alongside routine success. An incomplete or interrupted task can reveal weaknesses that a carefully guided demonstration leaves hidden.
Make cognitive burden visible
Ease of use involves what a person must notice, understand, remember, decide and physically do. A tidy interface can still demand substantial mental effort.
Human performance depends on limited attention, working memory and feedback. Examine how the concept supports those processes during a task.
Does it make the relevant information perceptible? Can the user understand its meaning? Is the next action clear? Can they recognize whether that action succeeded?
Look for unnecessary steps, demands to remember information across screens and alerts that interrupt without helping a decision. The best change may simplify a sequence or improve feedback rather than add another feature. Confirm its effect through observation and appropriate measures.
Measure effort alongside task success
Choose measures that reflect the priority outcome and the study’s purpose. These may include completion time, errors, requests for help, repeated actions or failure to notice important information.
Subjective workload measures can complement observed performance. NASA Task Load Index can help structure participants’ assessment of workload, while PURE provides an expert assessment of the effort required to complete tasks. Satisfaction ratings on a Likert scale can be used to compare concepts directly with each other and a baseline solution.
Do not treat one measure as a complete account of usability. Faster completion may accompany misunderstanding. A participant may complete the task correctly while reporting effort that makes repeated use impractical.
Interpret results together and examine the conditions under which they occurred. Record the limitations so decision makers understand what the test has established.
Test demand separately from technical feasibility
Pretotyping examines whether people take meaningful action toward using or adopting an idea before the full solution exists. It addresses a different question from whether a working product can be engineered.
A clearly described concept, service simulation or expression-of-interest process may provide evidence about engagement. The strength of that evidence depends on the action required and the conditions surrounding it.
A click demonstrates less commitment than a substantive implementation conversation. Neither establishes clinical efficacy or successful device use.
For medical concepts, keep representations accurate and make the test status clear. Interpret behavioral evidence alongside clinical appropriateness, access requirements and the responsibilities of the people making adoption decisions. Interest alone cannot establish that the solution should proceed unchanged, particularly when workflows in the clinical setting are involved.
Refine the value proposition with evidence
A value proposition explains which customer the concept serves, the job it supports and the difficulties it intends to reduce. It should connect directly with the outcomes identified through research.
Compare that proposition with the evidence from concept tests. Did participants experience the intended benefit? Did another difficulty become more important? Did the concept require assumptions that the intended setting cannot support? Did the concept do something better than a competitor’s current solution?
Capture both positive and negative findings. Use them to revise the concept, the proposition or the team’s understanding of the need.
Then test the important changes. Iteration should answer a question left open by the previous round. Repeating sessions without changing the artifact or research objective can accumulate comments while leaving uncertainty untouched.
Keep early findings within their proper limits
Early concept validation supports decisions about direction and investment. It does not establish all the evidence needed for a finished medical device.
Technical performance, reliability, clinical benefit and intended-use safety require appropriate subsequent work. A convincing simulated experience may depend on functions the team has not yet demonstrated.
Make these boundaries visible in the decision record. State who participated, what was tested, the conditions, findings and unresolved issues. Explain how those findings affect the next commitment.
Overall, having a “winning concept” in hand, backed by user Experience Café data along with user needs in the form of outcome statements formally structured with a direction of improvement and unit of measure, sets a development team up for success. The outcome statement user needs provide a solid foundation for the design history file.
Rapid prototype experience testing gives the team answers to key decisions and sets a target to pursue early on. This results in faster development cycles, more robust regulatory submissions, and better returns on investment spending.
A Value Management Office can connect this learning with resources and stage decisions. Testing should help the organization commit at a pace justified by evidence and concentrate effort on the uncertainties that govern progress.
“Early validation creates value when it changes the concept or the commitment before an unresolved assumption becomes expensive.”
What comes next
Examine one proposed investment. Which assumption could defeat the concept, and what is the least costly credible way to test it?
Prepare an appropriate artifact, involve representative users and observe meaningful tasks. Review the evidence, revise the concept and record the next learning decision. This gives Patient Centered Design a practical route toward solutions people can successfully use and organizations can responsibly develop.


